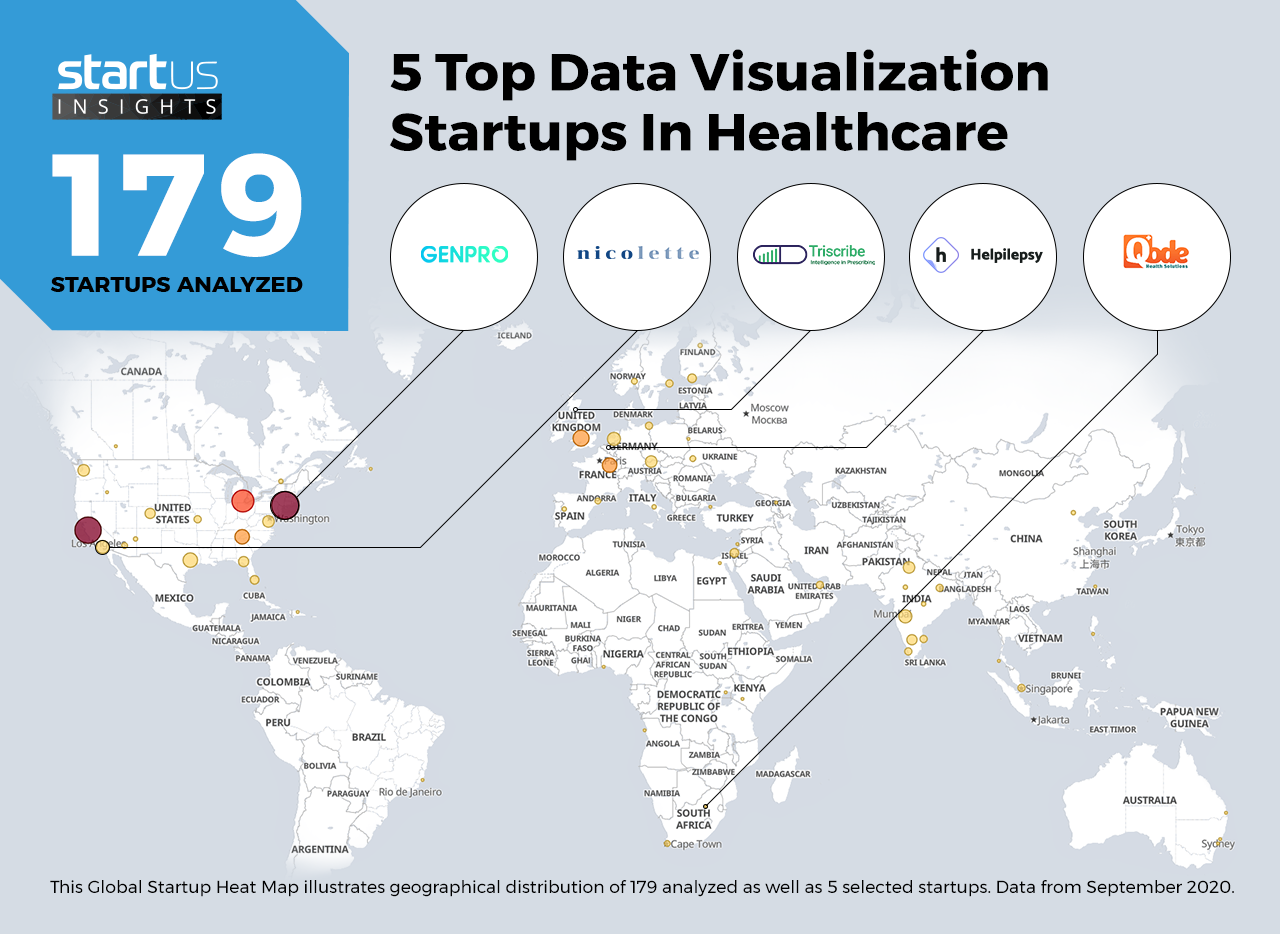
Our Innovation Analysts recently looked into emerging technologies and up-and-coming startups working on innovative solutions for the healthcare sector. As there is a large number of startups working on a wide variety of solutions, we want to share our insights with you. This time, we are taking a look at 5 promising data visualization startups.
Heat Map: 5 Top Data Visualization Startups
Using our StartUs Insights Discovery Platform, covering 1.379.000+ startups & scaleups globally, we looked at innovation in the field of healthcare. For this research, we identified 179 relevant solutions and picked 5 to showcase below. These companies were chosen based on a data-driven startup scouting approach, taking into account factors such as location, founding year, and relevance of technology, among others. Depending on your specific criteria, the top picks might look entirely different.
The Global Startup Heat Map below highlights 5 startups & scaleups developing data visualization solutions. Moreover, the Heat Map reveals regions that observe a high startup activity and illustrates the geographic distribution of all 179 companies we analyzed for this specific topic.
Triscribe – Health Analytics
As healthcare companies embrace digitization, vast amounts of data are processed by systems like electronic health records (EHRs) and e-prescriptions. Data visualization and analytics turn this data into insightful information that helps hospitals and doctors optimize daily procedures, such as patient intake or medication tracking. Moreover, data visualization enables the analysis of many therapeutic interventions and even hospital-acquired infections in an effort to better understand them and eradicate them.
Triscribe is a UK-based startup that builds a solution for health analytics. Their software provides full visibility of the data logged in e-prescribing systems. The startup’s visual analytics tool enables hospitals and clinics to optimize medicine usage. Moreover, it measures the impact of clinical interventions and investigates infection incidents to prevent future ones.
Qode Health Solutions – Health Information System (HIS)
In addition to patient data, hospitals generate data on operational management, inventory management, and practice management. Health information systems integrate all of this data and provide a global picture of processes within a hospital or clinic. This enables decision-makers to optimize systems to increase intake and improve the quality of healthcare.
Qode Health Solutions is a South African startup that offers visual analytics for healthcare organizations. The startup’s solutions span data collection, data integration, and data processing, as well as information modeling and visualization. These visual analytics offer real-time insights into pivotal financial and operational data of a hospital or a clinic. This fully eliminates the time consumed in manual compilation and reporting thereby saving substantial costs.
Nicolette – Parenting Dashboard
New parents frequently have to visit the doctor when their babies fall sick with a range of conditions, such as colds, fevers, or skin problems. Data visualization-powered dashboards enable parents to better understand their babies’ health. In addition to enhancing baby care, these dashboards also improve the parents’ participation in the process.
Nicolette is a US-based startup that develops such a parenting dashboard. NicoBoard visualizes electronic medical records (EMR), enabling parents to be more aware of their baby’s health conditions. The solution also features a healthcare team directory, insights, diary, and access to physicians for telemedicine.
Genpro Research – Clinical Data Visualization
Clinicians collect large amounts of data from patients undergoing prognosis or diagnosis, as well as those enrolled in clinical trials. This data is crucial to understand why certain therapeutic interventions work and others don’t, and why sometimes adverse events occur. Startups are working on data visualization solutions that increase the efficiency and accuracy of data analysis and assist clinical decision making.
The US-based startup Genpro Research offers solutions for clinical data visualization. The startup’s solutions use artificial intelligence (AI), machine learning, and natural language processing (NLP) to automate processes in drug development. The startup’s clinical data analysis and visualization tool, MOSS, uses deep learning and NLP to convert a question from a clinician into a structured query. The database-agnostic tool handles both simple and complex charts to enable clinicians to analyze on-the-go.
Helpilepsy – Digital Assistant
Digital assistants are increasingly becoming common in healthcare, advancing the growth of telemedicine. Startups are integrating interactive data visualization solutions in digital assistants. These visuals enable patients and doctors to easily access and understand the medical history of each patient thereby improving the quality of care and enhanced patient compliance.
Helpilepsy is a Belgian startup that develops a digital assistant for epilepsy patients and their neurologists. A structured, interactive, and actionable dashboard provides more information to the doctors, which enables them to provide better care and better manage appointments. The visual tool also helps patients themselves to better manage, track, and understand their symptoms.
What About The Other 174 Solutions?
While we believe data is key to creating insights it can be easy to be overwhelmed by it. Our ambition is to create a comprehensive overview, provide actionable innovation intelligence, and enable you to achieve your goals faster. The 5 data visualization startups showcased above are promising examples out of 179 we analyzed for this article. To identify the most relevant solutions based on your specific criteria, get in touch.


